
If you run CNC machines, you’ve probably heard the term OEE thrown around in a lean manufacturing meeting and nodded along. But most shops that “track OEE” are really only tracking uptime and missing the two other factors that decide whether a machine is actually making money.
This guide breaks down what Overall Equipment Effectiveness (OEE) really measures, walks through the formula with real machine-shop numbers, and shows how tooling decisions tap selection, feeds and speeds, changeover time directly move the needle on your score.
What OEE Actually Measures
Overall Equipment Effectiveness (OEE) is a single percentage that tells you how much of your machine’s full production potential you actually captured during a shift.
A machine can be running the entire shift and still have poor OEE if it’s running slow, or making scrap. OEE catches all three failure modes at once, which is why it’s more honest than a simple uptime metric.
It’s built from three components:
- Availability — was the machine running when it was supposed to be?
- Performance — was it running at the speed it’s capable of?
- Quality — did the parts it made actually pass inspection?
For a shop that lives and dies by cutting tools, all three are tied directly to tooling decisions. A worn tap causes a stoppage (Availability loss). The wrong feed rate for the material forces you to run slower than the tool is rated for (Performance loss). A tap that’s slightly out of spec produces oversized or torn threads (Quality loss). OEE is where tooling choices show up on a P&L.
The Formula
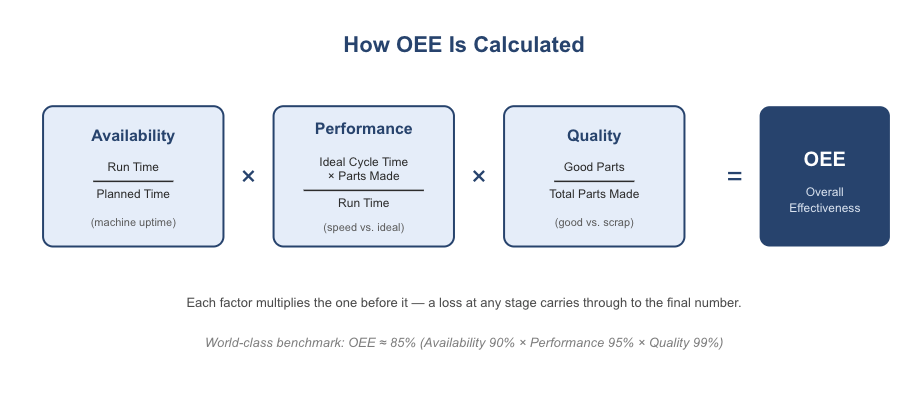
OEE = Availability × Performance × Quality
Note that it’s multiplication, not addition — each factor only acts on what survived the stage before it, so losses compound rather than average out. (This is the same reason forging reduction ratios and gear reduction ratios multiply across passes instead of adding.) A shop running at 90% Availability, 80% Performance, and 95% Quality doesn’t have an 88% OEE — it has 68%, because each loss eats into an already-shrunken number.
World-class OEE is generally considered ~85%. Most shops that have never formally tracked it land somewhere between 40–60% the first time they measure honestly not because the shop is badly run, but because nobody had visibility into all three factors at once.
Why Run time is taken while measuring performance and not the planned time ???
Performance measures speed only during the time the machine was actually running not against the full planned time. Availability already accounted for the time lost to stoppages. If Performance used Planned Time again, you’d be penalizing the same downtime twice.
Example: Planned = 480 min, Downtime = 8 min, Run Time = 472 min, Ideal Cycle = 18 sec, Total Parts = 1,150, Good Parts = 1,090.
Correct (using Run Time in Performance):
- Performance = (18 × 1,150) ÷ 472 ÷ 60 = 73.1%
- OEE = 98.3% × 73.1% × 94.8% = 68.1%
- Check: (18 × 1,090) ÷ 60 ÷ 480 = 327 ÷ 480 = 68.1% ✓ — matches exactly
If you wrongly used Planned Time instead:
- Performance’ = (18 × 1,150) ÷ 480 ÷ 60 = 71.9%
- OEE’ = 98.3% × 71.9% × 94.8% = 66.9% ✗ — does not match the 68.1% check
The second version is wrong because the 8 minutes of downtime already got punished once in Availability, and then got punished again by inflating the denominator in Performance — double-counting the same loss.
Breaking Down the Three Components
1. Availability
Availability = Run Time ÷ Planned Production Time
This captures every minute the machine wasn’t cutting when it was supposed to be: breakdowns, tool changes, waiting on material, setup and changeover.
Worked example — a shift on a CNC tapping station:
| Item | Value |
|---|---|
| Planned Production Time | 480 min (8-hr shift) |
| Downtime (tool change + minor stops logged) | 8 min |
| Run Time | 480 − 8 = 472 min |
Availability = 472 ÷ 480 = 98.3%
2. Performance
Performance = (Ideal Cycle Time × Total Parts Produced) ÷ Run Time
This catches the gap between how fast the machine could run a part and how fast it actually did — including minor stops too short to log individually, and any deliberate speed reduction (e.g., backing off feed rate to protect a tap in a tough alloy).
Same shift, continued:
| Item | Value |
|---|---|
| Ideal Cycle Time | 18 sec/part |
| Total Parts Produced | 1,150 |
| Run Time | 472 min |
Performance = (18 × 1,150) ÷ 472 ÷ 60 = 73.1%
A Performance score this low is a strong signal the shop is running below the tool’s rated speed often because an older tap type can’t hold up at the ideal feed rate, so the operator compensates by slowing down.
3. Quality
Quality = Good Parts ÷ Total Parts Produced
Every part that fails inspection — oversized thread, torn thread, broken tap leaving a ruined bore — counts against this number, even if the machine ran all shift at full speed.
| Item | Value |
|---|---|
| Total Parts Produced | 1,150 |
| Good Parts | 1,090 |
| Reject Parts | 60 |
Quality = 1,090 ÷ 1,150 = 94.8%
Putting It Together
OEE = 98.3% × 73.1% × 94.8% = 68.1%
Despite the machine running almost the entire shift with a solid quality rate, overall effectiveness lands well below world-class — and the Performance number is the clear place to dig deeper.
The Six Big Losses
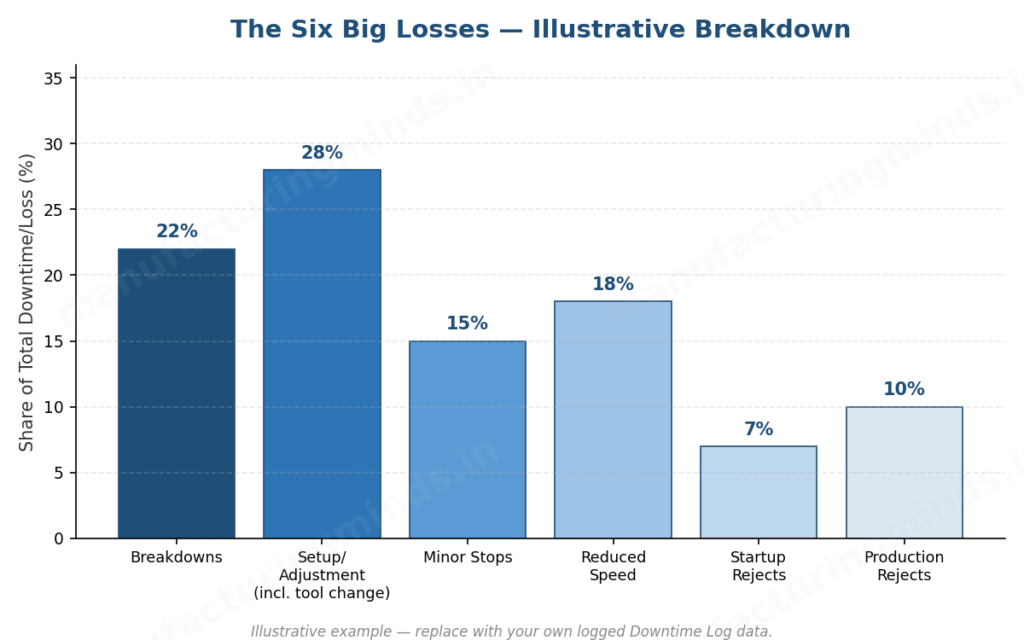
OEE’s three components break down further into six specific loss categories — this is the level where you can actually trace a number back to a cause on the shop floor.
| Category | Affects | Common Tooling-Related Cause |
|---|---|---|
| Breakdowns | Availability | Tool failure/breakage mid-cycle, spindle damage from a snapped tap |
| Setup & Adjustment | Availability | Tool changeovers, re-indexing after a tap change |
| Minor Stops | Performance | Chip jams, clearing broken tap fragments |
| Reduced Speed | Performance | Running below rated feed/speed to protect a tool not suited to the material |
| Startup Rejects | Quality | Scrap during warm-up before feeds/speeds are dialed in with a new tool |
| Production Rejects | Quality | Oversized/torn threads from tool wear, incorrect tap geometry for the material |
Logging which category a stoppage falls under (not just its duration) is what turns a downtime log into something you can actually act on it’s the difference between “we lost 40 minutes today” and “we lost 40 minutes to tool changes on one specific tap style.”
Illustrative Case Study: The Cost of the Wrong Tap
A shop tapping stainless steel blind holes was running a spiral point tap on a job better suited to a spiral flute tap. Spiral point taps push chips forward, ahead of the tap — ideal for through-holes, where the chip exits out the bottom. In a blind hole, that same forward push has nowhere to go: chips pack up at the bottom of the hole, causing binding, tool breakage, and torn threads. Spiral flute taps solve this by pulling chips backward and up, out of the hole, the way a drill flute does — which is why they’re the standard choice for blind-hole tapping.
| Metric | Before (Spiral Point) | After (Switched to Spiral Flute) |
|---|---|---|
| Availability | 98.3% | 99.1% (fewer tool-breakage stops) |
| Performance | 73.1% | 84.6% (ran closer to rated feed rate) |
| Quality | 94.8% | 98.2% (fewer torn threads) |
| OEE | 68.1% | 80.8% |
Switching tool geometry to match the hole type — a change that costs nothing to implement — lifted OEE by roughly 12.7 percentage points. This is the kind of story that’s easy to find once you’re logging downtime by cause: most “performance” and “quality” losses trace back to a tool that was never right for the job in the first place.
Turning the OEE Gain Into Rupees
A percentage-point gain doesn’t mean much to a shop owner until it’s converted into parts and revenue. Here’s how to make that translation — using the same shift.
Step 1 — find the theoretical maximum output. At an 18-second ideal cycle time, the machine can theoretically produce 3,600 ÷ 18 = 200 parts/hour, or 1,600 parts over an 8-hour shift if it ran perfectly.
Step 2 — multiply by OEE to get actual good output.
| Before (68.1% OEE) | After (80.8% OEE) | |
|---|---|---|
| Good parts per shift | 1,600 × 68.1% ≈ 1,090 | 1,600 × 80.8% ≈ 1,293 |
| Extra good parts per shift | +203 |
Step 3 — apply your own per-part margin. (The figure below is a placeholder — use your actual contribution margin per part.) At an illustrative ₹200/part margin, 203 extra good parts is ~₹40,600 in extra margin per shift, or roughly ₹1.01 crore/year run across 250 production shifts — from a tooling swap that cost nothing to implement.
The exact rupee figure will vary a lot by part and shop — the point of the exercise is the method: extra good parts = (OEE gain) × (theoretical max output), then multiply by your own margin per part. This is usually the single most convincing line in an OEE pitch to a shop owner or plant manager, because it turns an abstract percentage into a number on a P&L.
How to Start Tracking This on Your Own Floor
You don’t need OEE software to start. A simple downtime log and a daily summary sheet — logged by cause, not just duration — is enough to get real numbers within a few shifts:
- Pick one machine to start with, ideally one running a tap or cutting tool style you want to evaluate.
- Log every stoppage: start time, end time, and which of the Six Big Losses it falls under.
- At the end of each shift, record planned time, ideal cycle time, parts produced, and good parts.
- Calculate Availability, Performance, and Quality, then multiply for OEE.
- If you’re testing a tooling change, run the same part/machine/operator combination before and after — that gives you a clean, credible before/after comparison.
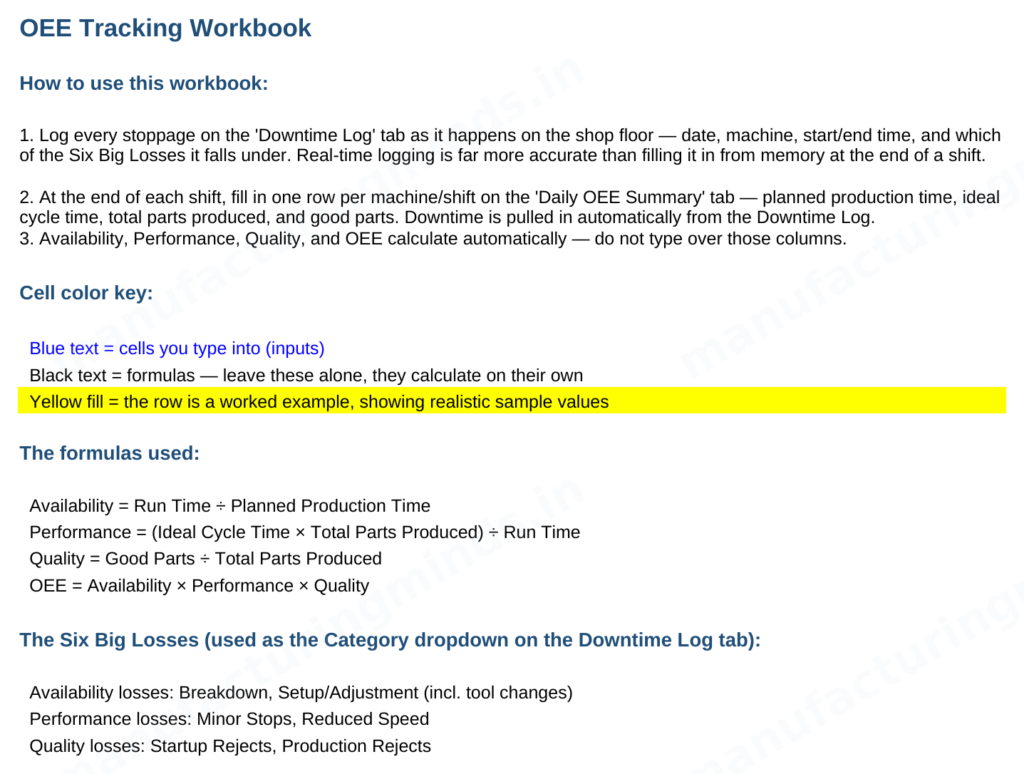
Here’s what that looks like in practice — a simple tracking workbook with the downtime log and daily summary already set up:
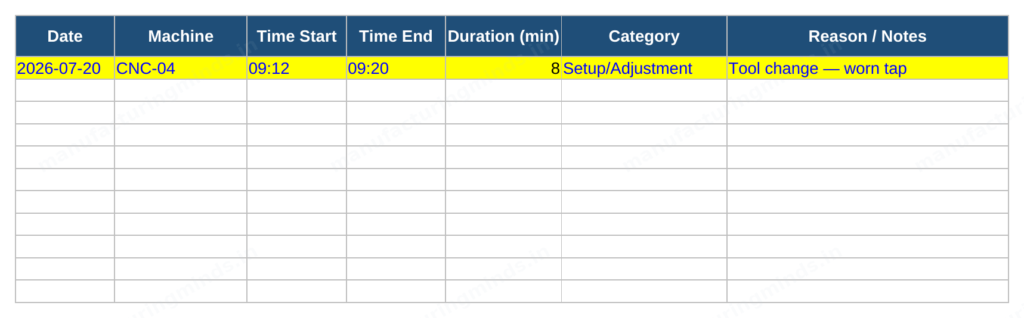
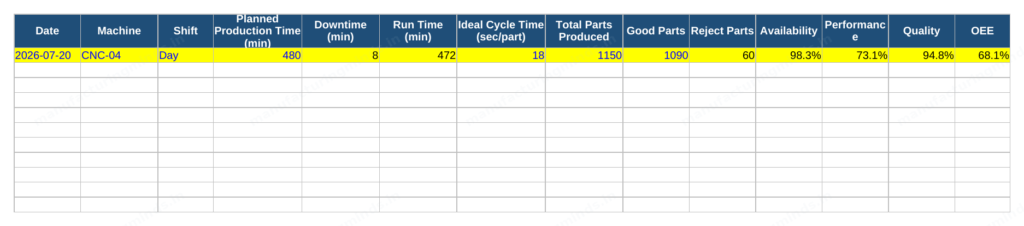
Download the free OEE Tracking Workbook (.xlsx)
The exact workbook shown above — Downtime Log, Daily OEE Summary, and Instructions tabs, formulas already built in. Just duplicate it, clear the example row, and start logging your first shift.
Quick Reference: The Formulas
| Metric | Formula |
|---|---|
| Availability | Run Time ÷ Planned Production Time |
| Performance | (Ideal Cycle Time × Total Parts Produced) ÷ Run Time |
| Quality | Good Parts ÷ Total Parts Produced |
| OEE | Availability × Performance × Quality |
FAQ
Why is OEE multiplied instead of averaged? Because each factor only acts on what survived the previous one — Performance only measures speed during the time the machine was already available, and Quality only measures the parts that were already produced at that speed. Averaging would hide the fact that losses compound. See the worked example above: 90%/80%/95% averages to 88% but multiplies to a real 68%.
What’s a good OEE score for a machine shop? 85% is generally considered world-class. Many shops measuring for the first time land between 40–60% — that’s normal, not a sign of bad management, and it’s exactly the starting point that makes improvement visible.
Does tool selection really move OEE that much? Yes — tooling affects all three components at once: Availability (breakage causing stops), Performance (running below rated speed to compensate for the wrong tool), and Quality (scrap from poor tool-to-material match). It’s often the highest-leverage variable a shop can change without capital investment.
Do I need software to track OEE? No. A logged downtime sheet and a daily summary with the formulas above is enough to get real, usable numbers — software just automates the aggregation once you’re tracking consistently.
📖 Check out our detailed article on taps — [Spiral Flute Tap vs Spiral Point Tap vs Straight Flute Tap: Which One Should You Use?] — for a deeper look at spiral point vs. spiral flute vs. forming taps, and how to match tap geometry to your material and hole type.
© 2026 Manufacturing Minds Precision LLP. All rights reserved. This content may not be reproduced without permission.